
Centralized Logging and Monitoring with Elastic Stack
Elasticsearch comes with very handy features in the new versions for collecting logs and also monitoring the hosts or docker containers. We can run elasticsearch and kibana with the following docker-compose file.
version: '2.2'
services:
  es01:
    image: docker.elastic.co/elasticsearch/elasticsearch:7.17.0
    container_name: es01
    environment:
      - discovery.type=single-node
      - bootstrap.memory_lock=true
      - "ES_JAVA_OPTS=-Xms512m -Xmx512m"
      - xpack.security.enabled=true
      - xpack.security.authc.api_key.enabled=true
      - xpack.security.audit.enabled=true
      - ELASTIC_PASSWORD=somethingsecret
    ulimits:
      memlock:
        soft: -1
        hard: -1
    volumes:
      - data01:/usr/share/elasticsearch/data
    ports:
      - 9200:9200
    networks:
      - elastic


  kib01:
    image: docker.elastic.co/kibana/kibana:7.17.0
    container_name: kib01
    ports:
      - 5601:5601
    environment:
      ELASTICSEARCH_URL: http://es01:9200
      ELASTICSEARCH_HOSTS: '["http://es01:9200"]'
      ELASTICSEARCH_USERNAME: elastic
      ELASTICSEARCH_PASSWORD: somethingsecret
      SERVER_PUBLICBASEURL: http://localhost:5601
      XPACK_ENCRYPTEDSAVEDOBJECTS_ENCRYPTIONKEY: "something_at_least_32_characters"
      XPACK_REPORTING_ENCRYPTIONKEY: "something_at_least_32_characters"
      XPACK_SECURITY_ENCRYPTIONKEY: "something_at_least_32_characters"
    depends_on:
      - es01
    networks:
      - elastic


volumes:
  data01:
    driver: local

networks:
  elastic:
    driver: bridge
Reference on configuring the kibana security:

Collecting Metrics with Metricbeat
We can run the following docker container in each host that we want to collect metrics from.
version: '3.8'
services:

  metricbeat:
    image: docker.elastic.co/beats/metricbeat:7.17.0
    user: root
    volumes:
      - /var/run/docker.sock:/var/run/docker.sock
      - ./metricbeat.docker.yml:/usr/share/metricbeat/metricbeat.yml:ro
      - /sys/fs/cgroup:/hostfs/sys/fs/cgroup:ro
      - /proc:/hostfs/proc:ro
      - /:/hostfs:ro
      - /var/log:/var/log:rw
      - /var/lib/docker/containers:/var/lib/docker/containers:rw
    network_mode: "host"
metricbeat configuration is provided with the metricbeat.docker.yml file:
metricbeat.max_start_delay: 10s
# setup.ilm.enabled: true
setup.dashboards.enabled: true
setup.dashboards.beat: metricbeat


#==========================  Modules configuration =============================
metricbeat.modules:

#-------------------------------- System Module --------------------------------
- module: system
  metricsets:
    - cpu             # CPU usage
    - load            # CPU load averages
    - memory          # Memory usage
    - network         # Network IO
    - process         # Per process metrics
    - process_summary # Process summary
    - uptime          # System Uptime
    - socket_summary  # Socket summary
    #- core           # Per CPU core usage
    #- diskio         # Disk IO
    #- filesystem     # File system usage for each mountpoint
    #- fsstat         # File system summary metrics
    #- raid           # Raid
    #- socket         # Sockets and connection info (linux only)
    #- service        # systemd service information
  enabled: true
  period: 10s
  processes: ['.*']

  # Configure the mount point of the host’s filesystem for use in monitoring a host from within a container
  #system.hostfs: "/hostfs"

  # Configure the metric types that are included by these metricsets.
  cpu.metrics:  ["percentages","normalized_percentages"]  # The other available option is ticks.
  core.metrics: ["percentages"]  # The other available option is ticks.

#-------------------------------- Docker Module --------------------------------
- module: docker
  metricsets:
    - "container"
    - "cpu"
    - "diskio"
    - "event"
    - "healthcheck"
    - "info"
    #- "image"
    - "memory"
    - "network"
    #- "network_summary"
  hosts: ["unix:///var/run/docker.sock"]
  period: 10s
  enabled: true

# ---------------------------- Elasticsearch Output ----------------------------
output.elasticsearch:
  hosts: ["localhost:9200"]
  username: "elastic"
  password: "somethingsecret"

setup.kibana:
    host: "localhost:5601"
    username: "elastic"
    password: "somethingsecret"
We use system module to collect the host metrics and docker module to collect stats via docker engine. Metricbeat supports many modules that can be integrated and used to collect metrics, such as we can collect metrics from docker, kubernetes, many databases, message queues like rabbitmq, kafka, and many more applications. You can find the modules and their configuration from here:
It is very easy to configure these modules and collect logs from various systems. For example we can collect metrics from rabbitmq server with the following configuration:
#------------------------------ Rabbit Module ---------------------------------
- module: rabbitmq
metricsets: ["node", "queue", "connection", "exchange"]
enabled: true
period: 10s
hosts: ["rabbithost:15672"]
username: admin
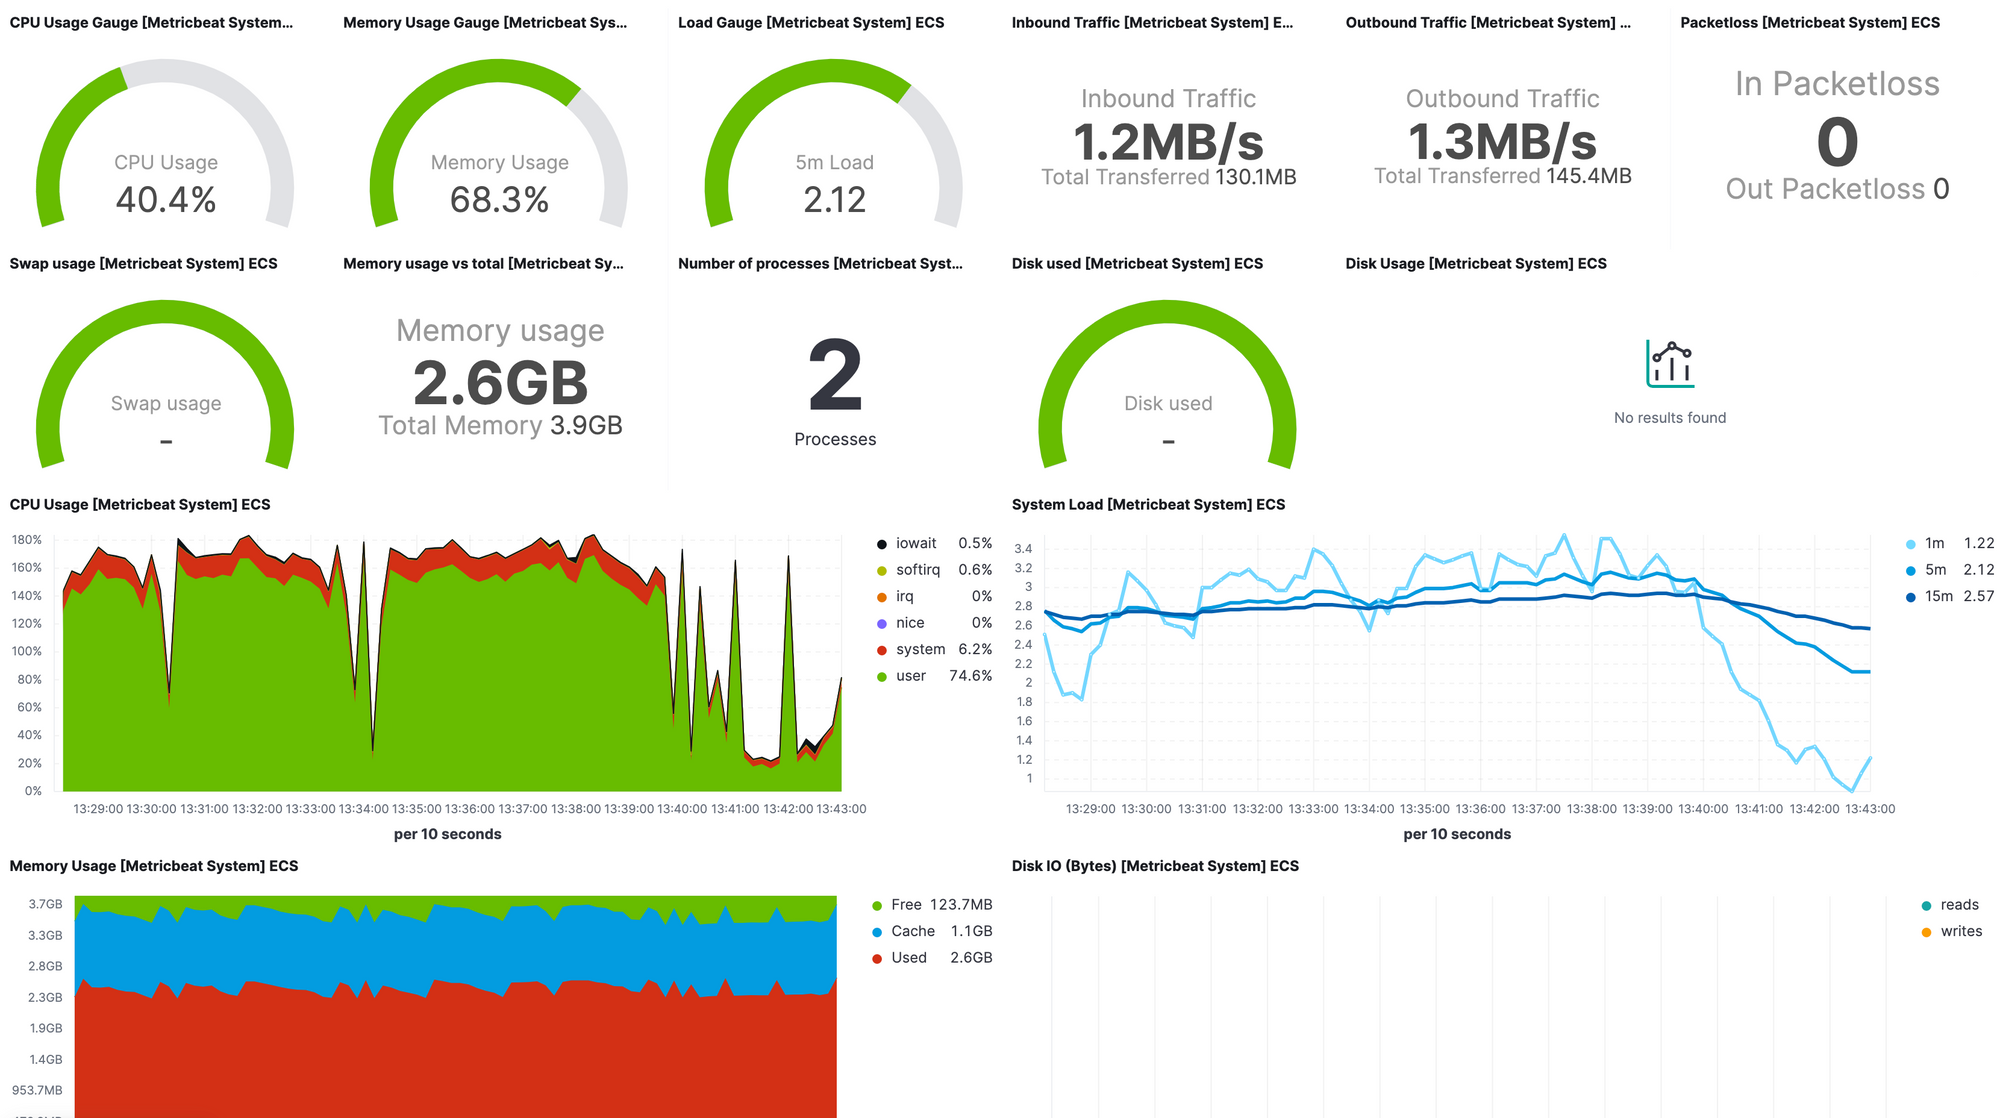
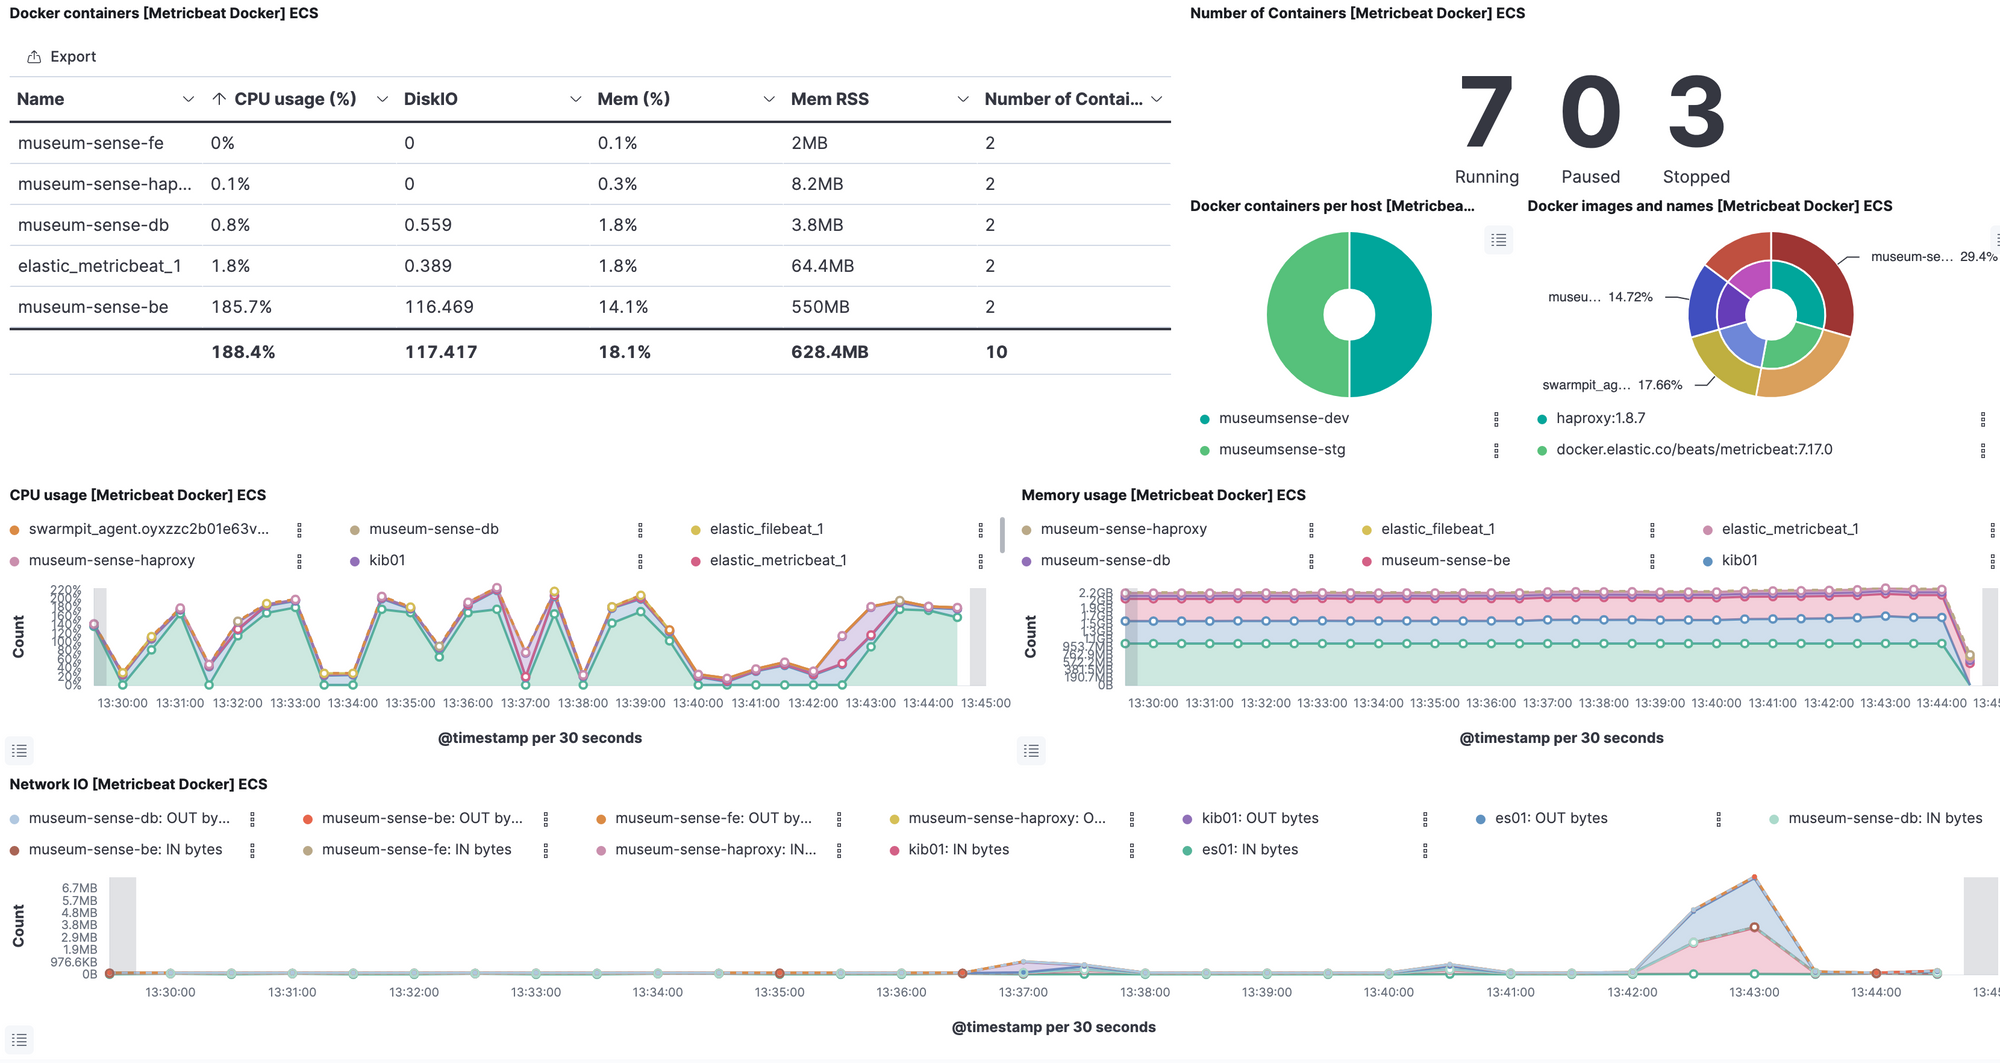
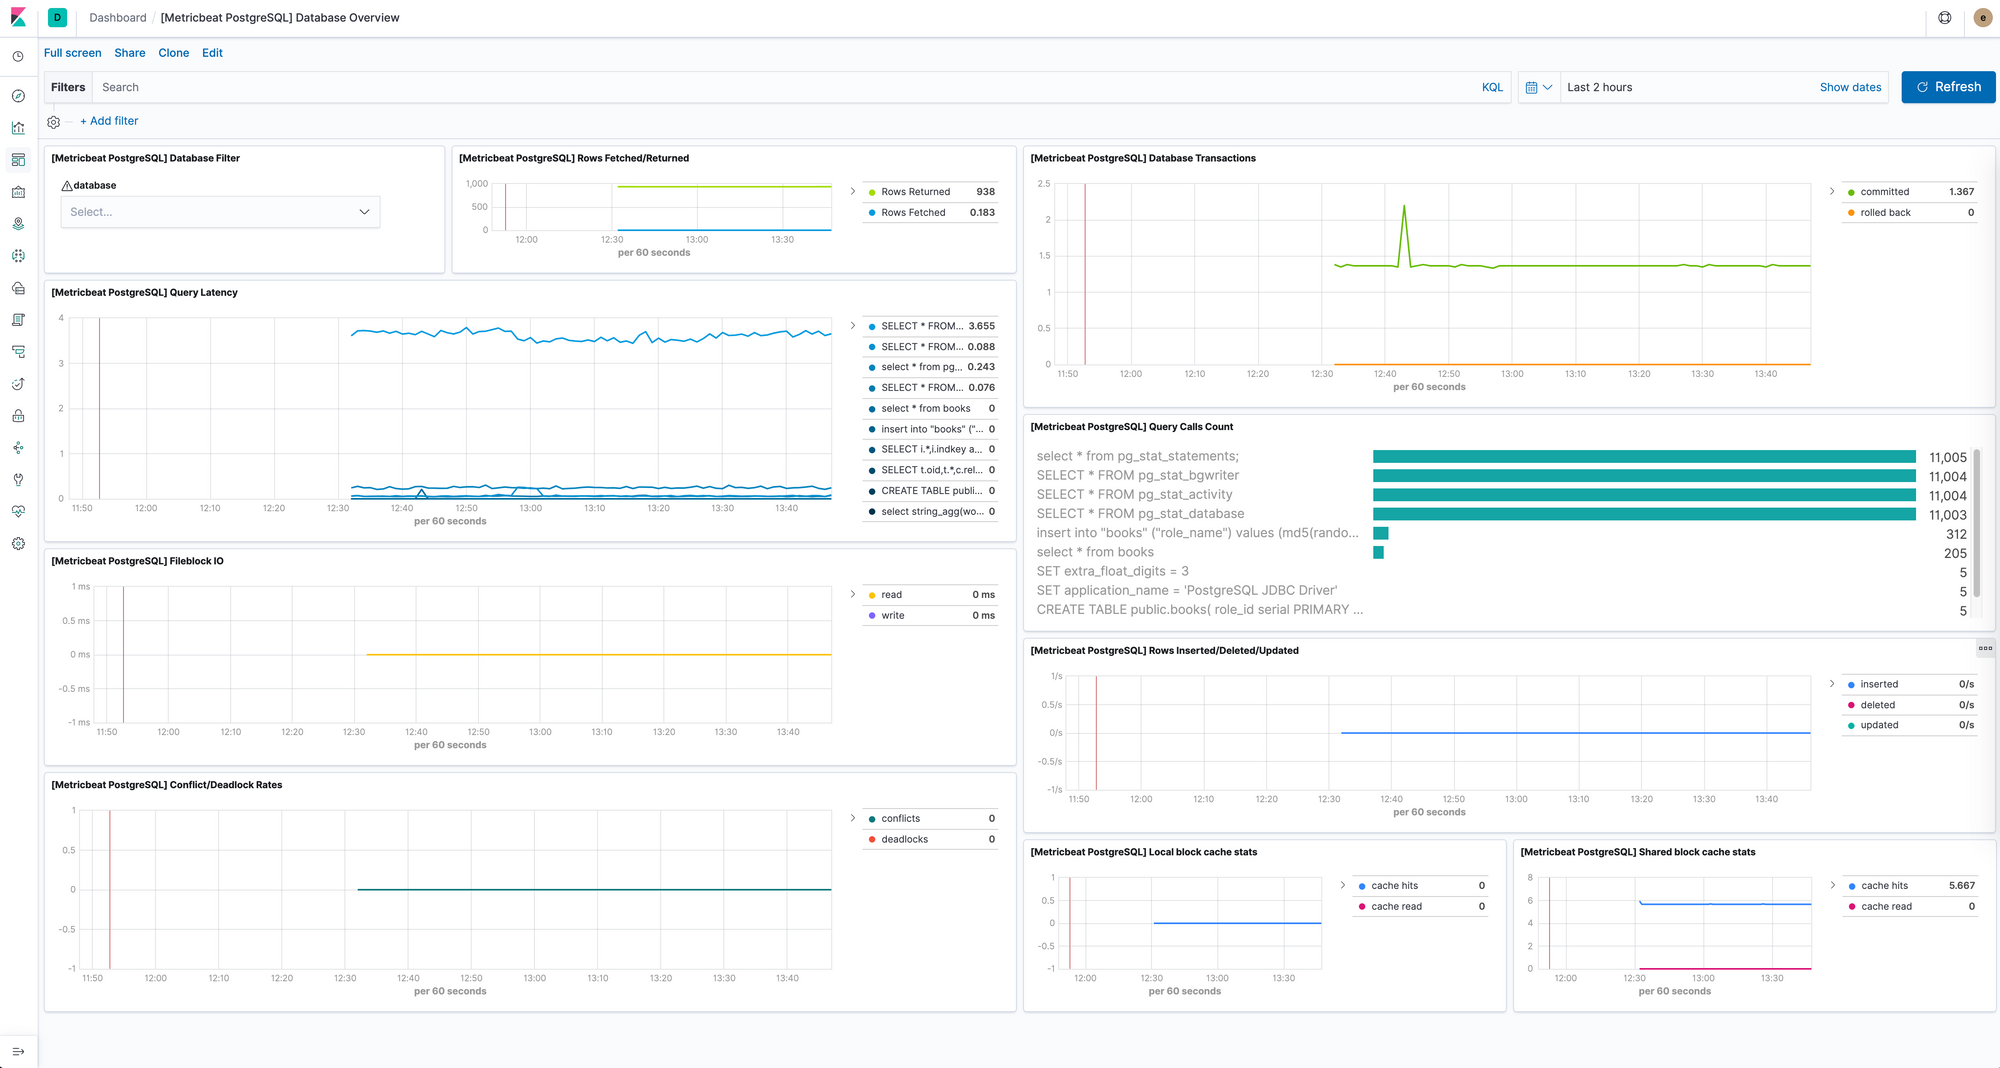
password: rabbit-passwordAs we enabled setup.dashboards.enabled config, metricbeat loads ready dashboards to kibana. We can customise or create new views or dashboards. Some of the ready dashboards looks as follows:
From the observability -> inventory we can view hosts and/or containers with metrics.
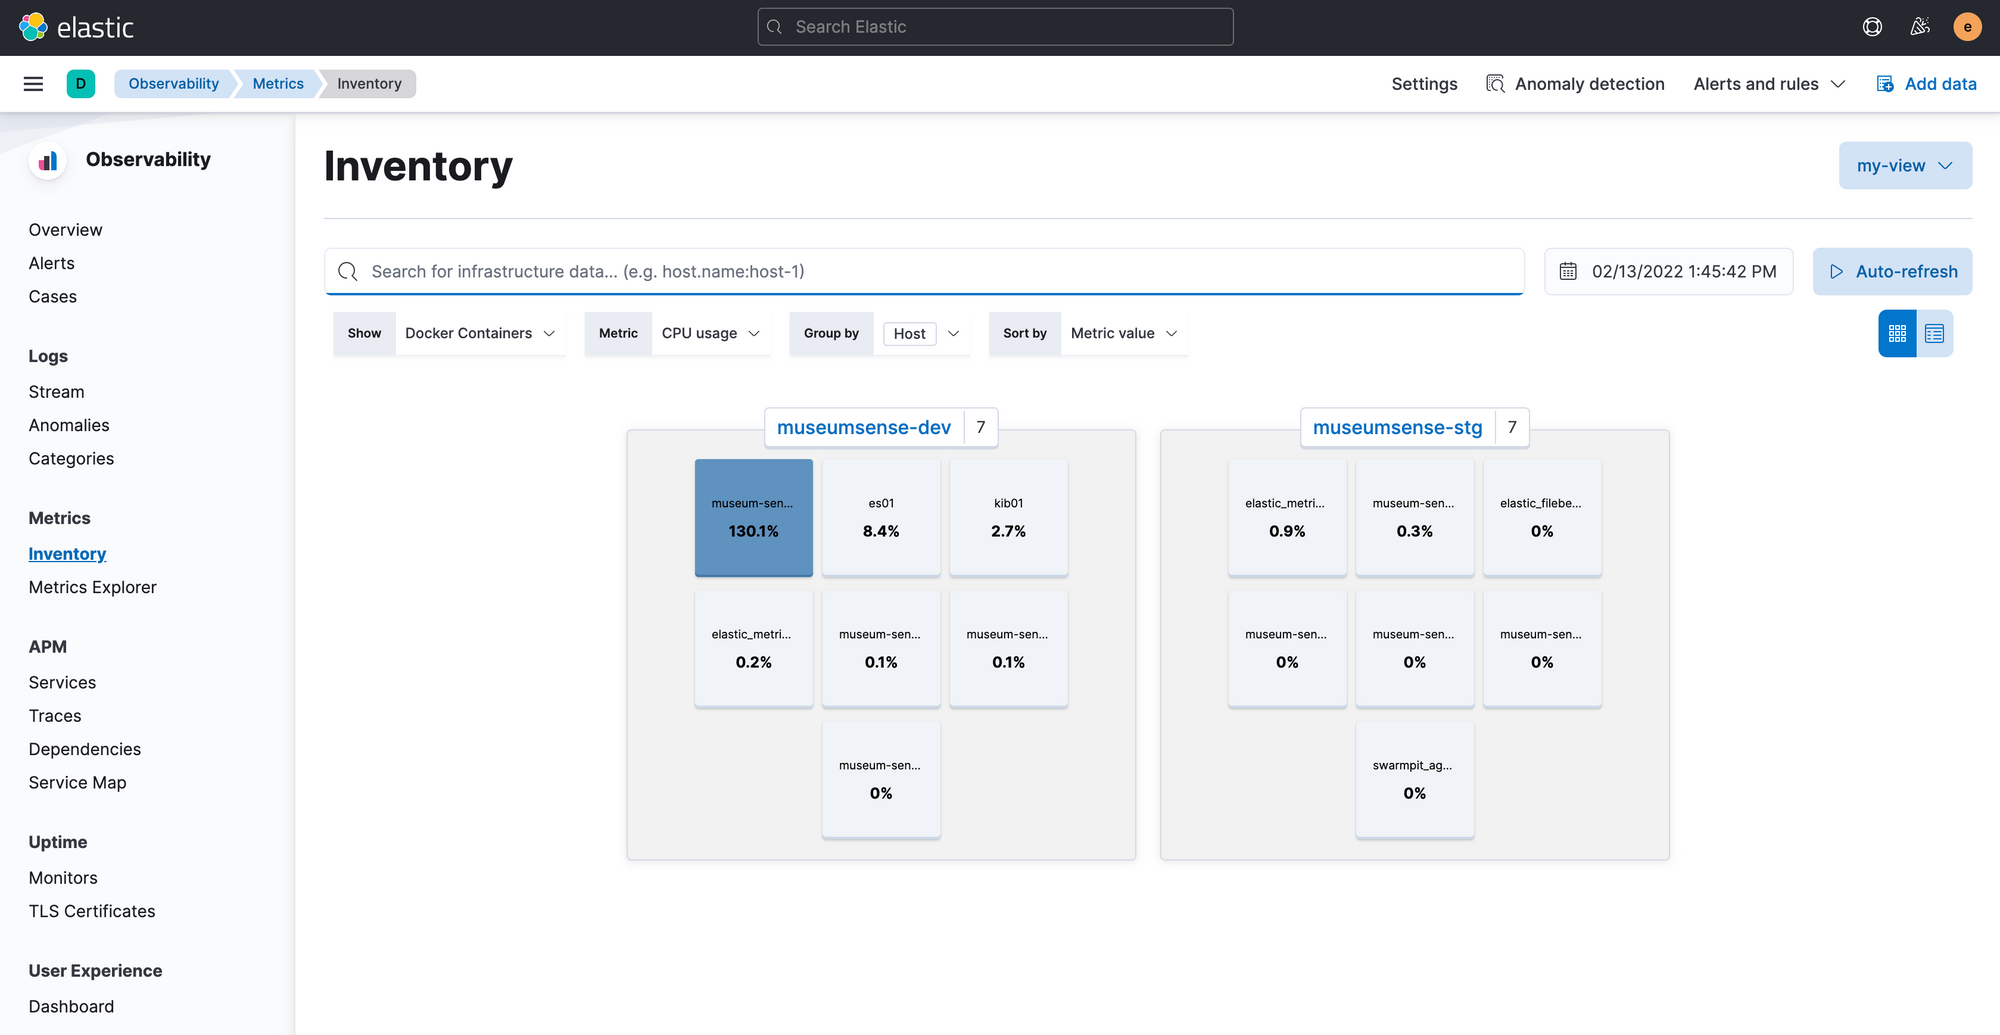
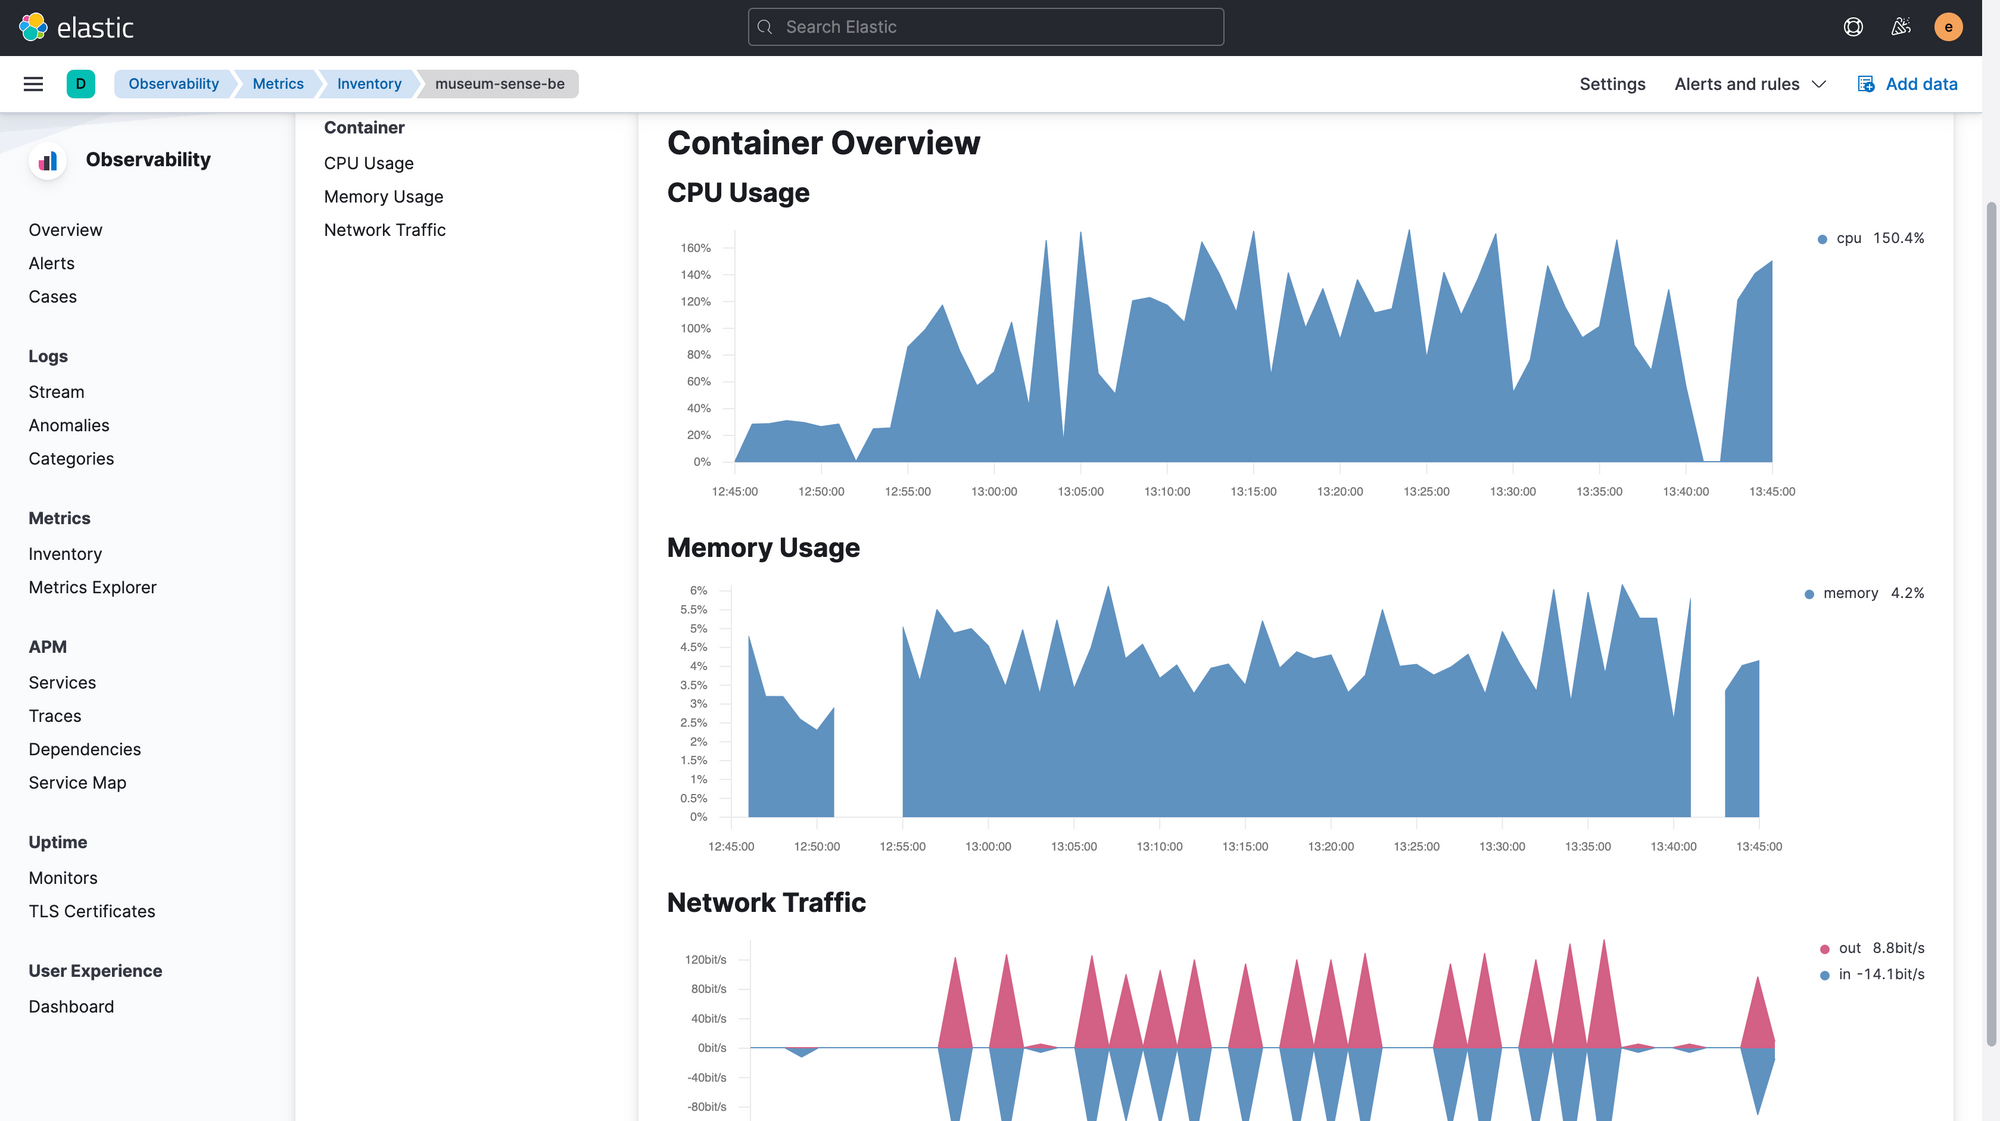
We can check the the logs (if we are collecting) or metrics of any host or container by clicking on the views here.
As mentioned before we can collect metrics from the databases i.e. postgresql and view the logs as follows:
Index Lifecycle Management
One of the nice features of elasticsearch in the new versions is the ILM (Index Lifecycle Management) which provides out of box feature to clean up documents from the indexes and storage. As far as I know, for the older versions, people had to run a separate process (curator) to clean old records.
At the moment Elasticsearch provides the following phases for ILM:
- Hot: The index is actively being updated and queried.
- Warm: The index is no longer being updated but is still being queried.
- Cold: The index is no longer being updated and is queried infrequently. The information still needs to be searchable, but it’s okay if those queries are slower.
- Frozen: The index is no longer being updated and is queried rarely. The information still needs to be searchable, but it’s okay if those queries are extremely slow.
- Delete: The index is no longer needed and can safely be removed.
ILM moves indices through the lifecycle according to their age. You can set how many days the records should stay in a phase and then it will go to the next phase and finally will be deleted (if configured so).
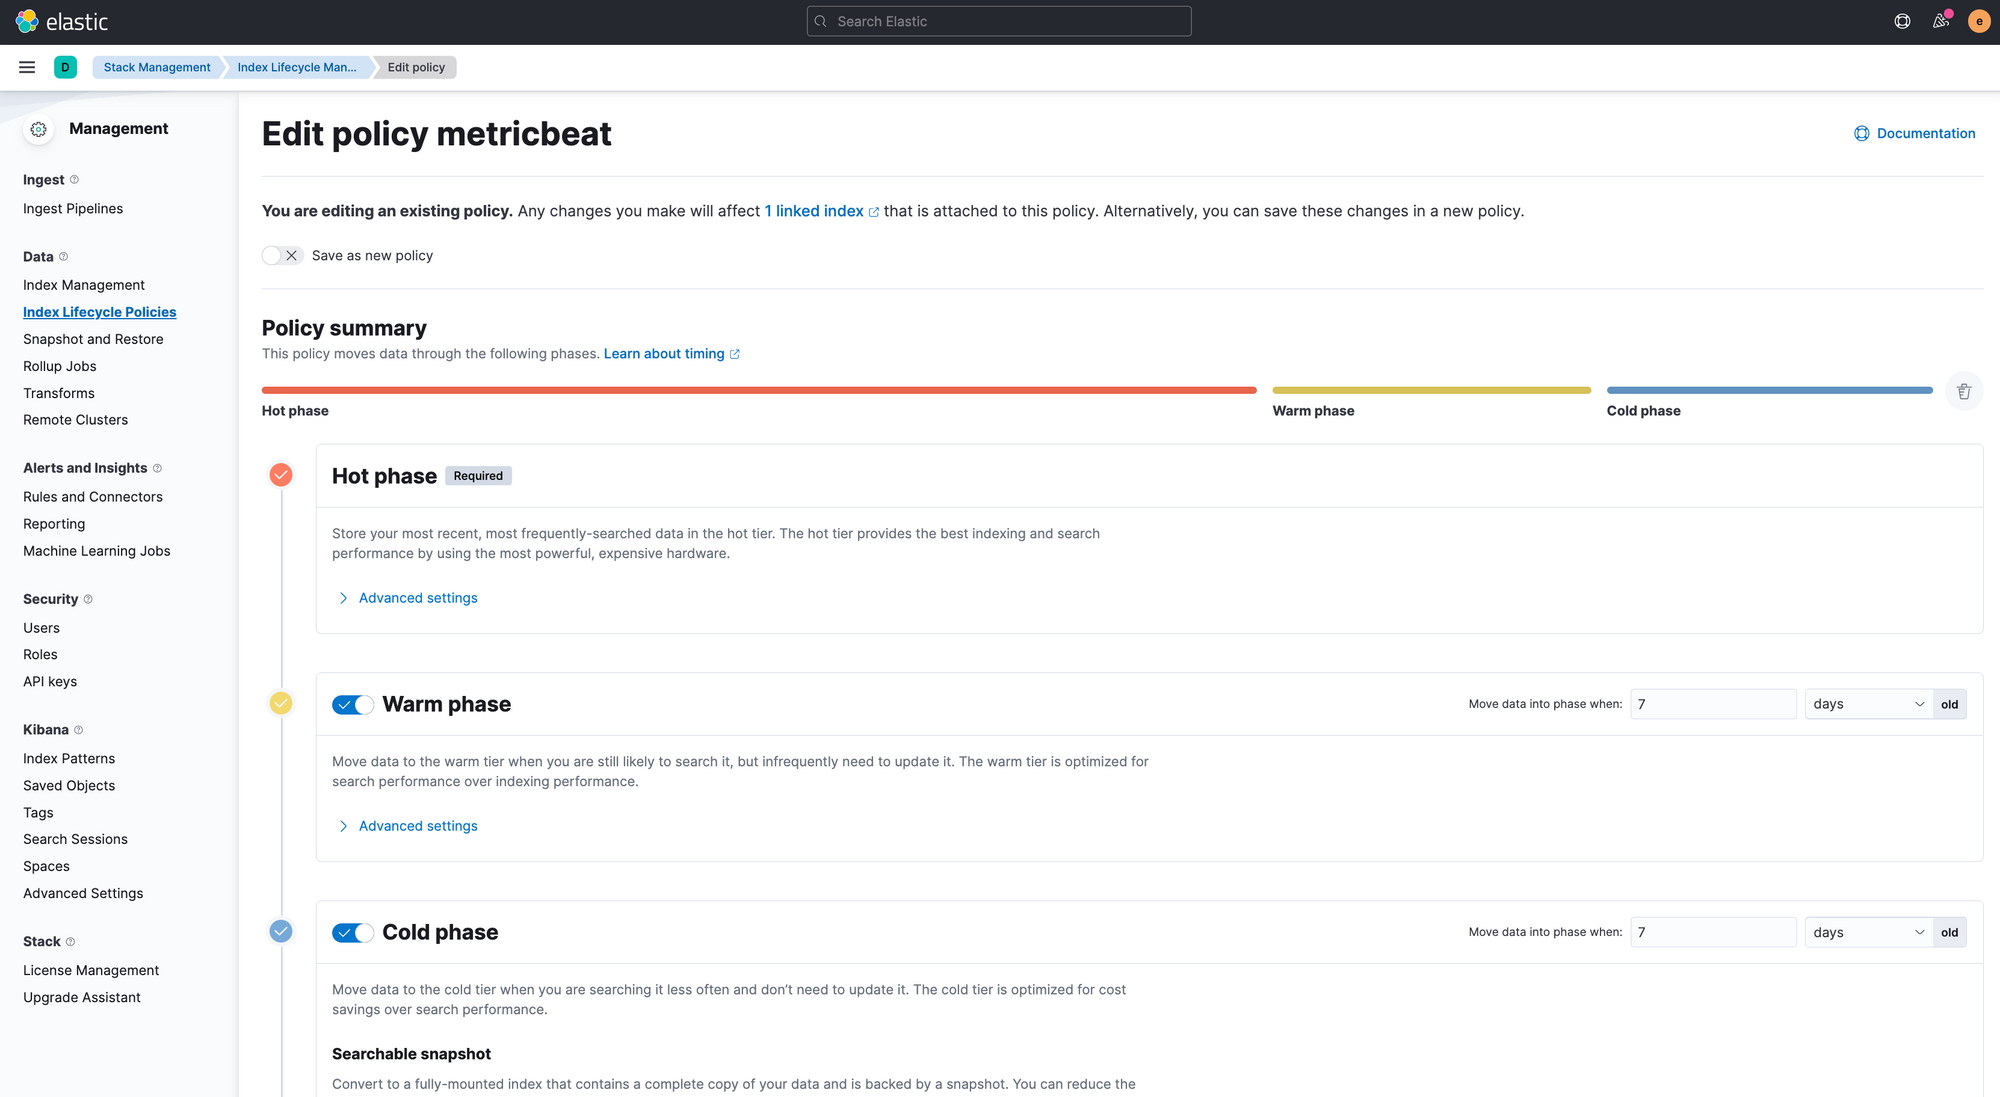
As we configured the metricbeat to collect the metrics per 10 second, it will pretty fast increase the disk size and collect GBs per day, in order to get rid of the older ones we can clean up via ILM policies. For further details please check the documentation:
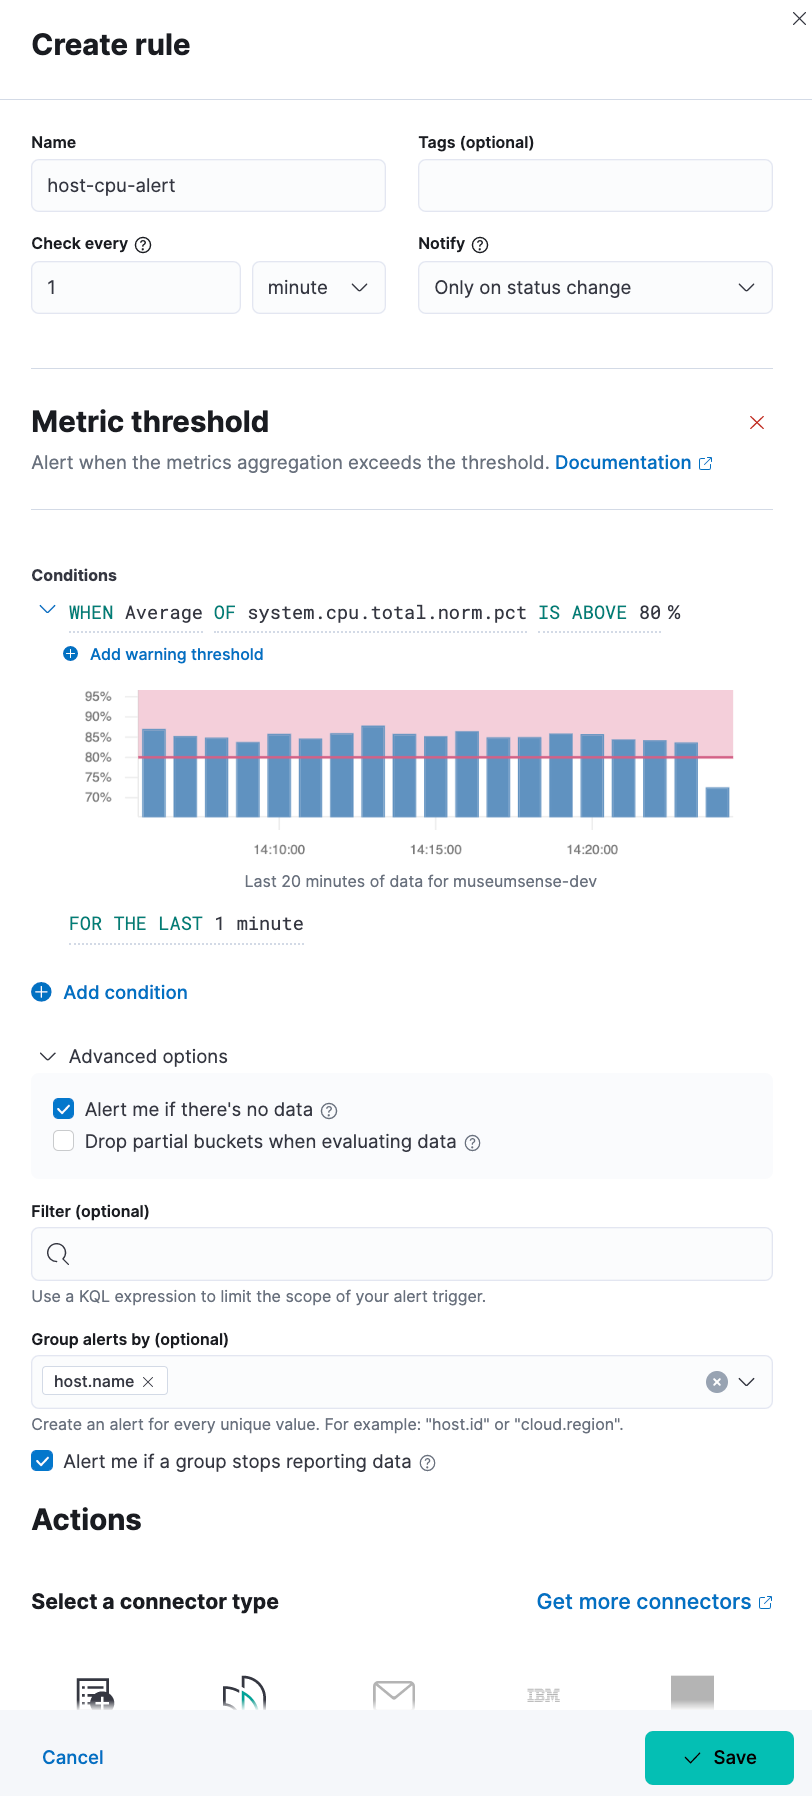
Setting Alerts For Metrics
To create an alert on metrics, we can go to Stack Management -> Alerts and Insights -> Rules and Connectors -> Create Rule. There are multiple rule types we can use, but I would like to show Metric Threshold type. We need to set a name for the rule, an interval to define how often to check, as the notify config we can select only on status change. We need to define which metrics to collect, for example: system.cpu.total.norm.pct average above 80%. We can also group by a field.
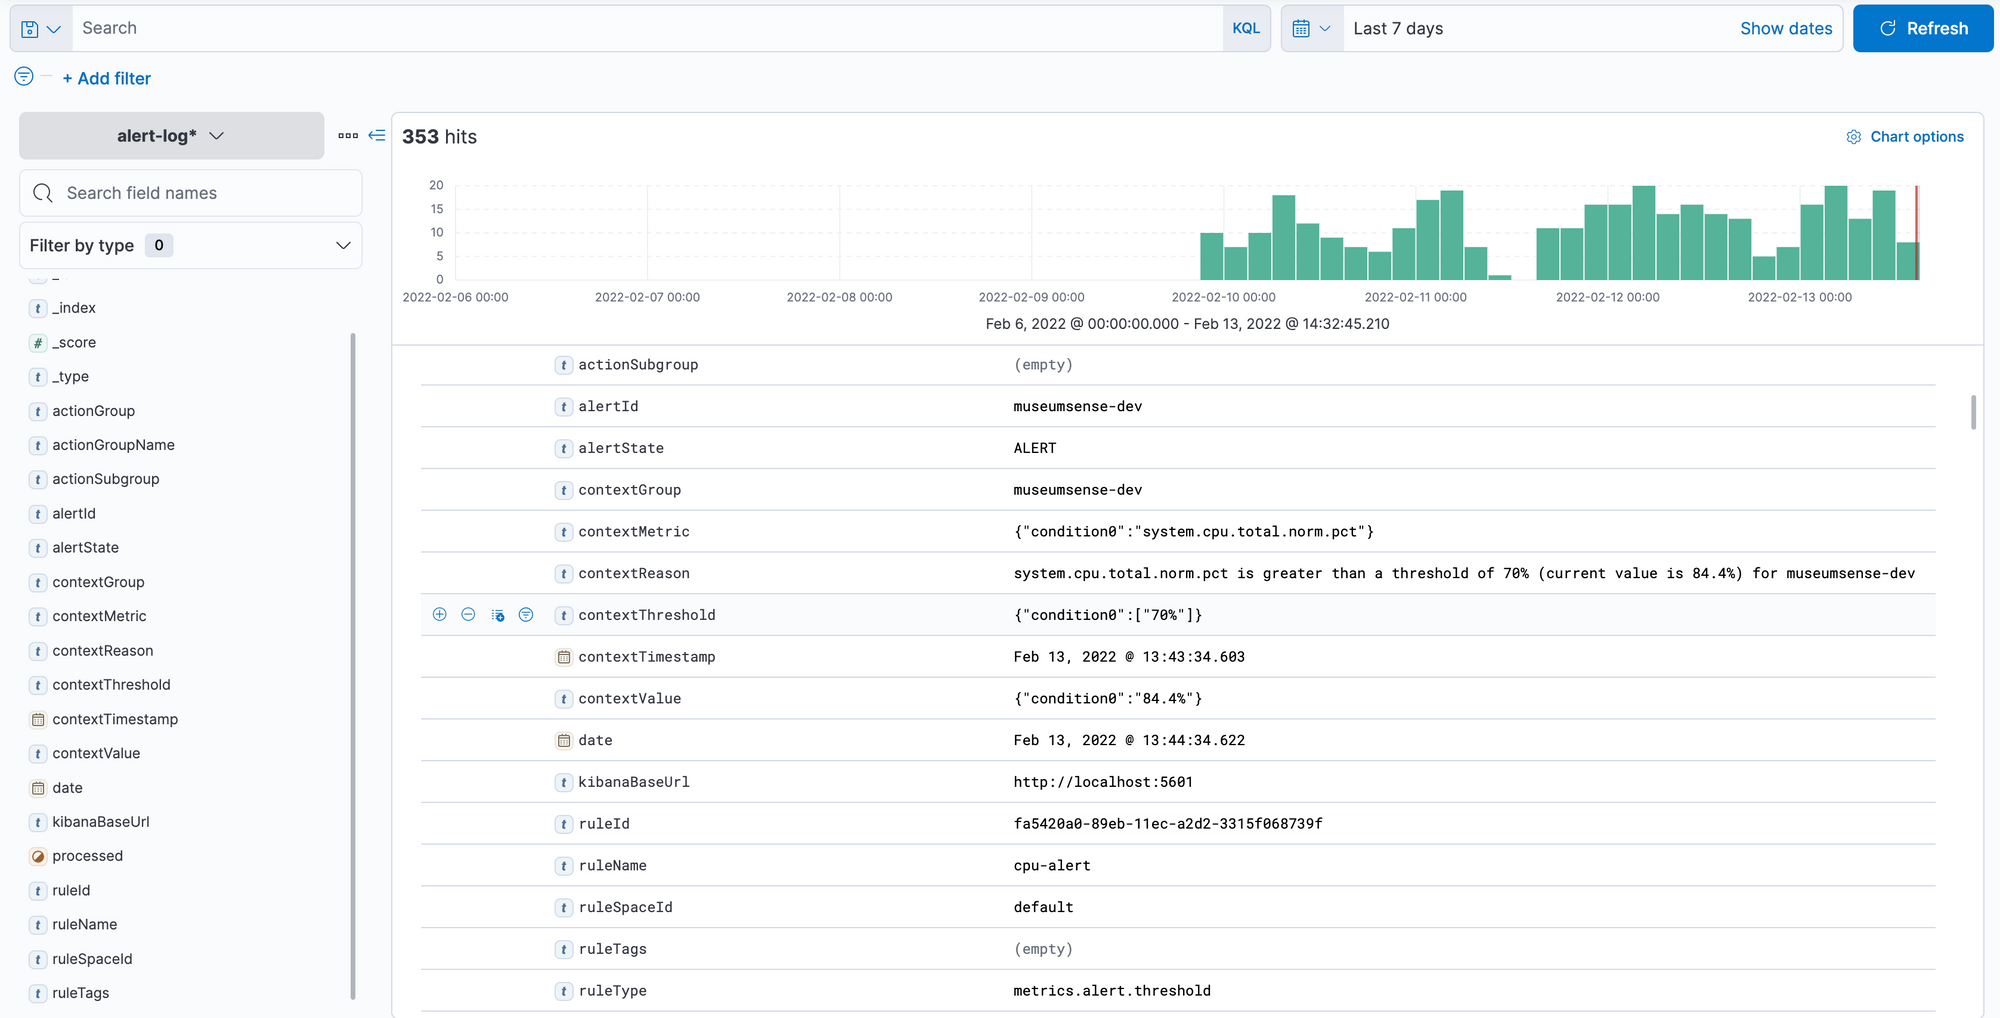
The actions in the free version is limited to Index and Server Log. In the paid versions of subscriptions there are many more options as Email, Slack, Jira, Webhook etc. As I am using the free version for now, I will select the Index action, which will write alert details to an index. When we select the alert action we need to define which fields from the alert event we want to record as a json document.
{
    "actionGroup": "{{alert.actionGroup}}",
    "actionGroupName":"{{alert.actionGroupName}}",
    "actionSubgroup":"{{alert.actionSubgroup}}",
    "alertId":"{{alert.id}}",
    "alertState":"{{context.alertState}}",
    "contextGroup":"{{context.group}}",
    "contextMetric":"{{context.metric}}",
    "contextReason":"{{context.reason}}",
    "contextThreshold":"{{context.threshold}}",
    "contextTimestamp":"{{context.timestamp}}",
    "contextValue":"{{context.value}}",
    "date":"{{date}}",
    "kibanaBaseUrl":"{{kibanaBaseUrl}}",
    "ruleId":"{{rule.id}}",
    "ruleName":"{{rule.name}}",
    "ruleSpaceId":"{{rule.spaceId}}",
    "ruleTags":"{{rule.tags}}",
    "ruleType":"{{rule.type}}"
}
We created new index to write the alert and specified that with a connector as follows:
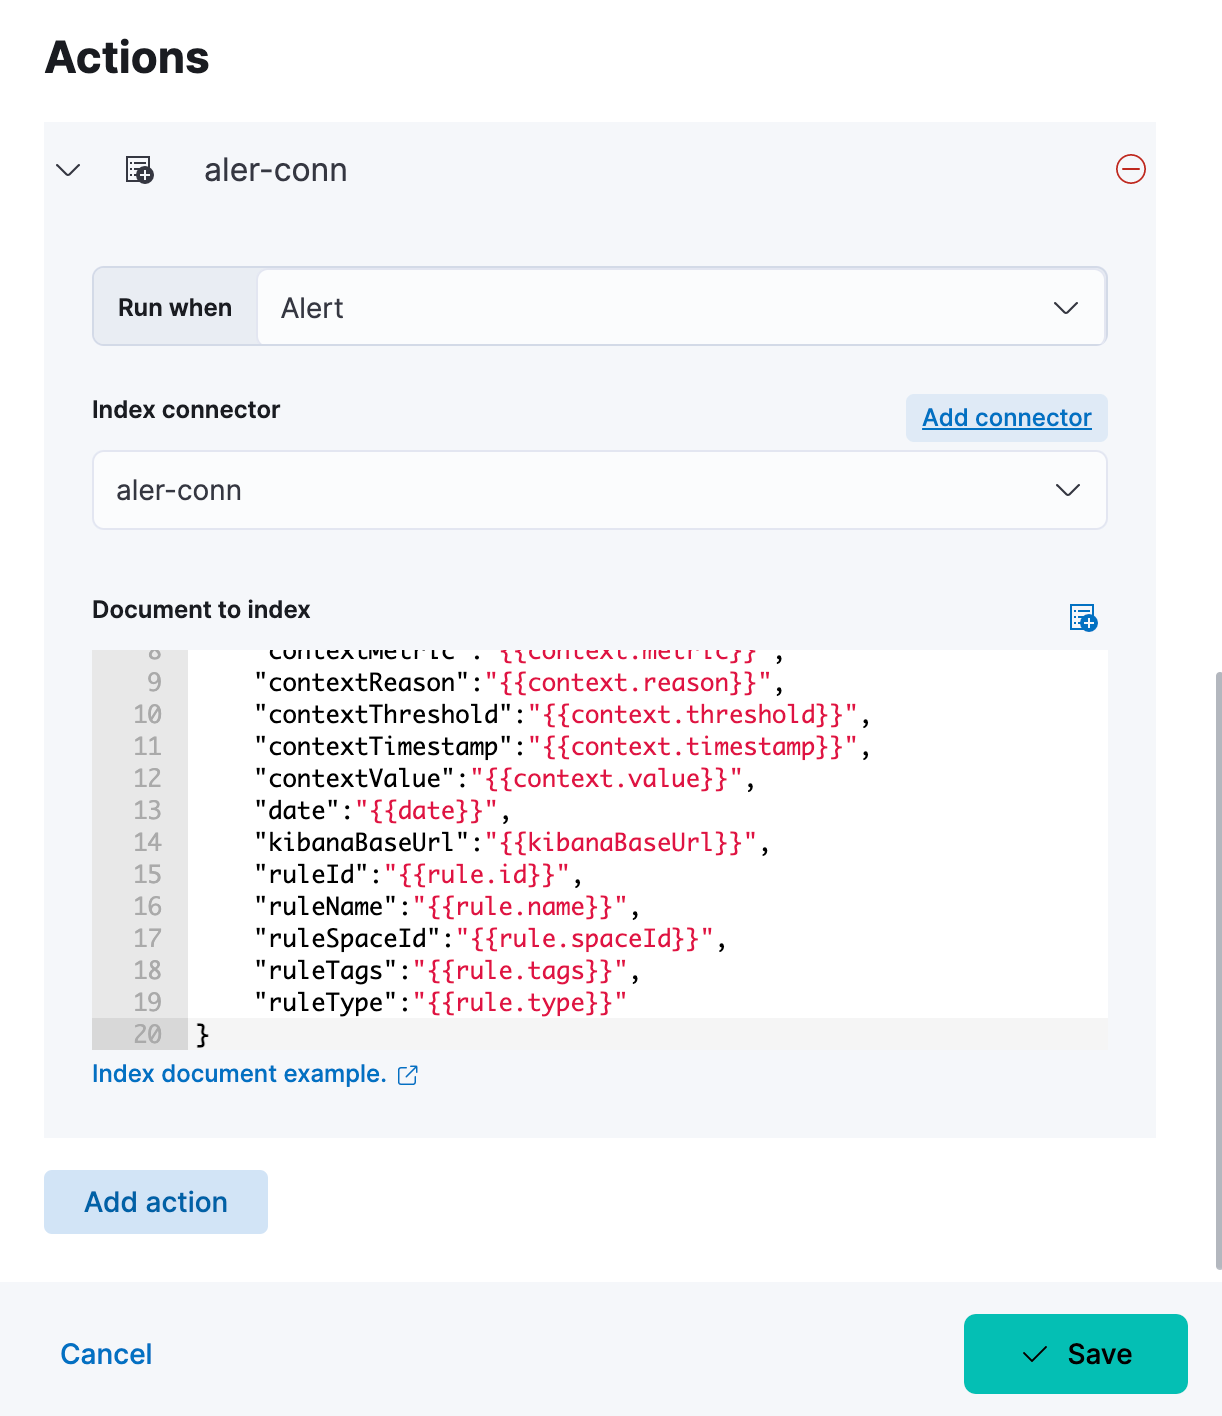
If you check the alert-logs index we can see that triggered alerts are saved to this index.
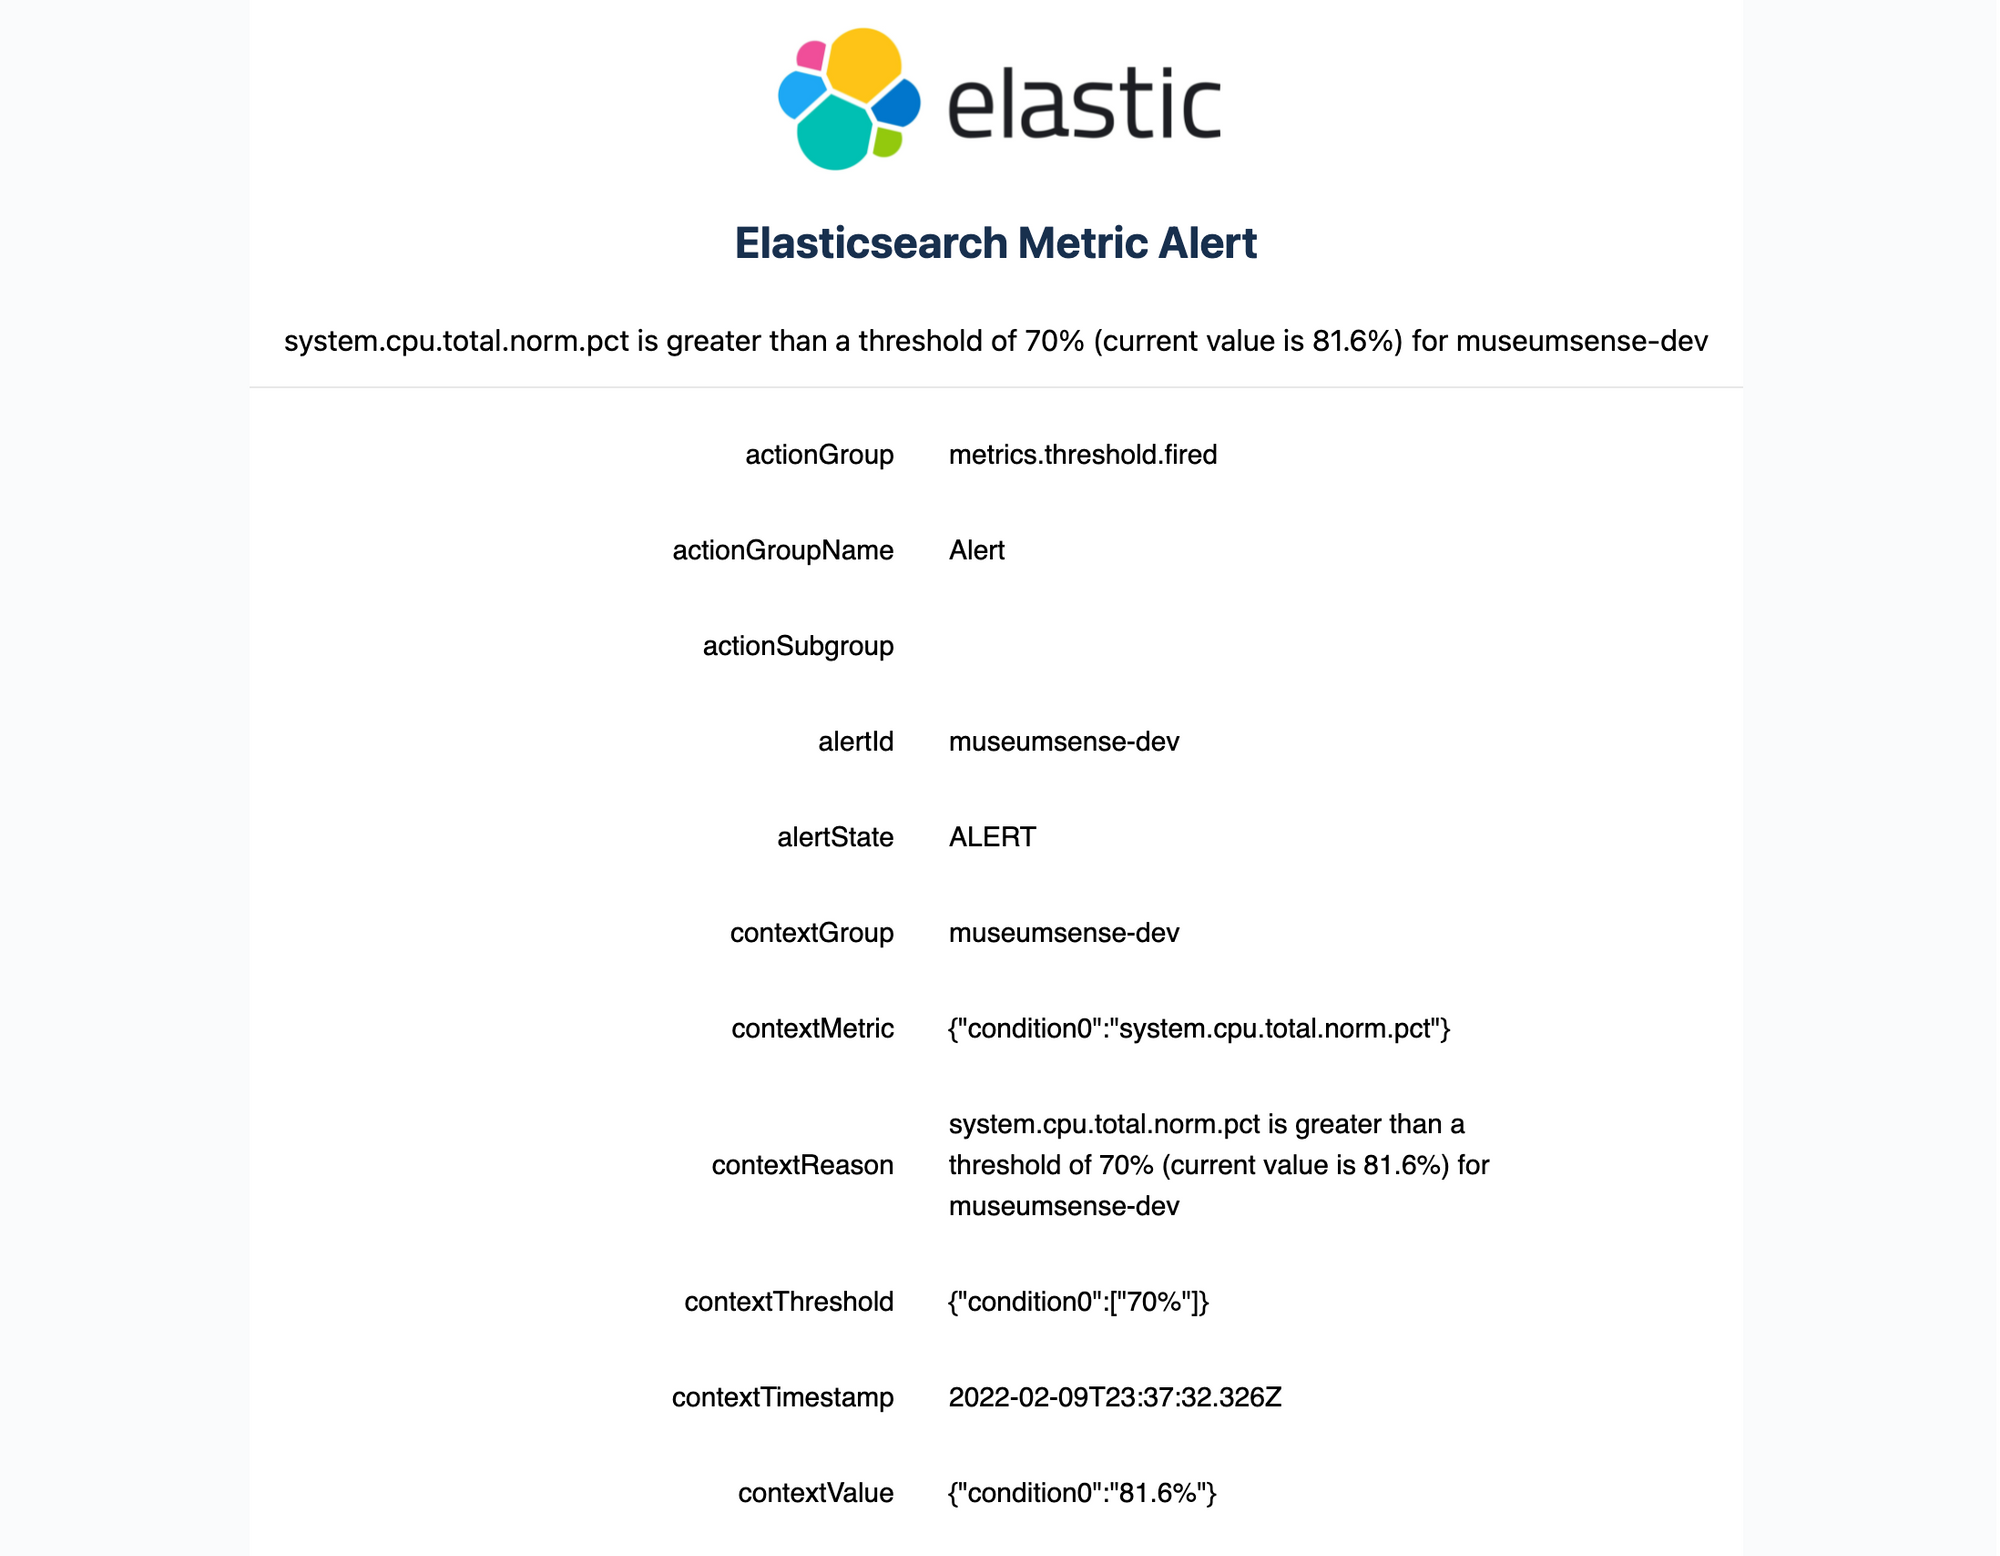
If you are using free license and want to receive email alerts, you can use the following tool that I was preparing to trigger email alerts.
 turkogluc
There are few environment variables to configure and run it. It is very light-weighted tool and can be used to send email alerts from indexes. An example email looks like as follows:
Collecting Logs
Metricbeat is used to collect the metrics, and to collect the logs we can use filebeat as follows:
version: '3.8'
services:

  filebeat:
    image: docker.elastic.co/beats/filebeat:7.17.0
    user: root
    volumes:
      - ./filebeat.docker.yml:/usr/share/filebeat/filebeat.yml:ro
      - /var/log/custom:/var/log/custom:ro
We can provide the configuration filebeat.docker.yml as follows:
setup.dashboards.enabled: true
setup.dashboards.beat: filebeat

#=========================== Filebeat inputs =============================

filebeat.inputs:

- type: log
  enabled: true
  paths:
    - /var/log/custom/*.json

  json.keys_under_root: true
  json.overwrite_keys: true
  json.add_error_key: true
  json.expand_keys: true

  # Decode JSON options. Enable this if your logs are structured in JSON.
  # JSON key on which to apply the line filtering and multiline settings. This key
  # must be top level and its value must be string, otherwise it is ignored. If
  # no text key is defined, the line filtering and multiline features cannot be used.
  #json.message_key:

  # By default, the decoded JSON is placed under a "json" key in the output document.
  # If you enable this setting, the keys are copied top level in the output document.
  #json.keys_under_root: false

  # If keys_under_root and this setting are enabled, then the values from the decoded
  # JSON object overwrite the fields that Filebeat normally adds (type, source, offset, etc.)
  # in case of conflicts.
  #json.overwrite_keys: false

  # If this setting is enabled, then keys in the decoded JSON object will be recursively
  # de-dotted, and expanded into a hierarchical object structure.
  # For example, `{"a.b.c": 123}` would be expanded into `{"a":{"b":{"c":123}}}`.
  #json.expand_keys: false

  # If this setting is enabled, Filebeat adds a "error.message" and "error.key: json" key in case of JSON
  # unmarshaling errors or when a text key is defined in the configuration but cannot
  # be used.
  #json.add_error_key: false


# ---------------------------- Elasticsearch Output ----------------------------
output.elasticsearch:
  enabled: true
  hosts: ["localhost:9200"]
  username: "elastic"
  password: "somethingsecret"

setup.kibana:
  host: "localhost:5601"
  username: "elastic"
  password: "somethingsecret"
We can run this on every host that we want to collect the logs and it will ship the logs. Note that logs are collected from /var/log/custom folder and only json files. The applications should write the logs within this folder.
Application Level Logging for Java Application
For the spring or java applications we can configure the application logging compatible with log collectors and elasticsearch with ecs-logging.
We need to add the following dependency:
implementation 'co.elastic.logging:logback-ecs-encoder:1.3.2'And add the following logback.xml configuration:
<?xml version="1.0" encoding="UTF-8"?>
<configuration>
    <property name="LOG_FILE" value="${LOG_FILE:-spring.log}"/>
    <include resource="org/springframework/boot/logging/logback/defaults.xml"/>
    <include resource="org/springframework/boot/logging/logback/console-appender.xml" />
    <include resource="org/springframework/boot/logging/logback/file-appender.xml" />
    <include resource="co/elastic/logging/logback/boot/ecs-file-appender.xml" />
    <root level="INFO">
        <appender-ref ref="CONSOLE"/>
        <appender-ref ref="ECS_JSON_FILE"/>
        <appender-ref ref="FILE"/>
    </root>
</configuration>
The LOG_FILE environment variable can be used to specify the path and file name. For example export $LOG_FILE=/var/log/custom/app.log and then there will be app.log.json file will be created and written as well. Therefore filebeat can collect the logs from the specific folder.